Posted by tombennet
Data-driven marketing means understanding what works. This means not only having accurate data, but also having the right data.
Data integrity is obviously critical to good reporting, but Analytics auditing shouldn't focus solely on the validity of the tracking code. Even amongst digital marketing teams who place importance on reporting, I frequently encounter the attitude that a technically sound, out-of-the-box implementation of Google Analytics will provide all the insight you could require.
Because of this, Google Analytics is rarely used to its full potential. When it comes to deeper insights — analyzing the ROI of top-of-funnel marketing activities, the impact of content engagement on raw business KPIs, or the behavior of certain subsets of your audience, for example — many will overlook the ease with which these can be measured. All it takes is a little investment in your tracking setup and a careful consideration of what insight would be most valuable.
In this article, I’ll be exploring the ways in which the Custom dimensions feature can be used to supercharge your Google Analytics reporting setup. We’ll run through some practical examples before diving into the various options for implementation. By the end, you’ll be equipped to apply these techniques to your own reporting, and use them to prove your prowess to your clients or bosses.
What are custom dimensions?
In a nutshell, they enable you to record additional, non-standard data in Google Analytics. You can then pivot or segment your data based on these dimensions, similarly to how you would with standard dimensions like source, medium, city, or browser. Custom dimensions can even be used as filters at the View-level, allowing you to isolate a specific subset of your audience or traffic for deeper analysis.
In contrast to the Content Grouping feature — which allows you to bucket your existing pages into logical groups — custom dimensions let you attach entirely new data to hits, sessions, or users. This last point is critical; custom dimensions can take advantage of the different levels of scope offered by Google Analytics. This means your new dimension can apply to an individual user and all their subsequent interactions on your website, or to a single pageview hit.
For the purposes of this tutorial, we’re going to imagine a simple scenario: You run a popular e-commerce website with a content marketing strategy that hinges around your blog. We’ll start by illustrating some of the ways in which custom dimensions can provide a new perspective.
1. User engagement
You publish a series of tutorials on your blog, and while they perform well in organic search and in social, you struggle to demonstrate the monetary value of your continued efforts. You suspect that engagement with the tutorials correlates positively with eventual high-value purchases, and wish to demonstrate this in Analytics. By configuring a user-level custom dimension called "Commenter" which communicates a true/false depending on whether the user has ever commented on your blog, you can track the behavior of these engaged users.
2. User demographics
User login status is frequently recommended as a custom dimension, since it allows you to isolate your existing customers or loyal visitors. This can be a great source of insight, but we can take this one step further: Assuming that you collect additional (anonymous) data during the user registration process, why not fire this information to Analytics as a user-level custom dimension? In the case of our example website, let’s imagine that your user registration form includes a drop-down menu for occupation. By communicating users’ selections to Analytics, you can compare the purchase patterns of different professions.
3. Out-of-stock products
Most e-commerce sites have, at one time or another, encountered the SEO conundrum of product retirement. What should you do with product URLs that no longer exist? This is often framed as a question of whether to leave them online, redirect them, or 404 them. Less frequently investigated is their impact on conversion, or of the wider behavioral effects of stock level in general. By capturing out-of-stock pageviews as a custom dimension, we can justify our actions with data.
Now that we have a clear idea of the potential of custom dimensions, let’s dive into the process of implementation.
How to implement custom dimensions
All custom dimensions must first be created in the Google Analytics Admin interface. They exist on the Property level, not the View level, and non-premium Google Analytics accounts are allowed up to 20 custom dimensions per Property. Expand Custom Definitions, hit Custom Dimensions, and then the red New Custom Dimension button.
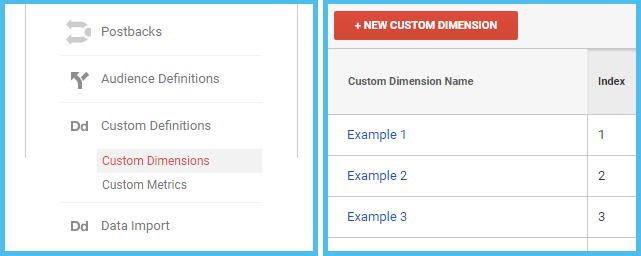
In the next screen, you’ll need to give your dimension a name, select a Scope (hit, session, user, or — for enhanced e-commerce implementations — product), and check the Active box to enable it. Hit Create, and you’ll be shown a boilerplate version of the code necessary to start collecting data.
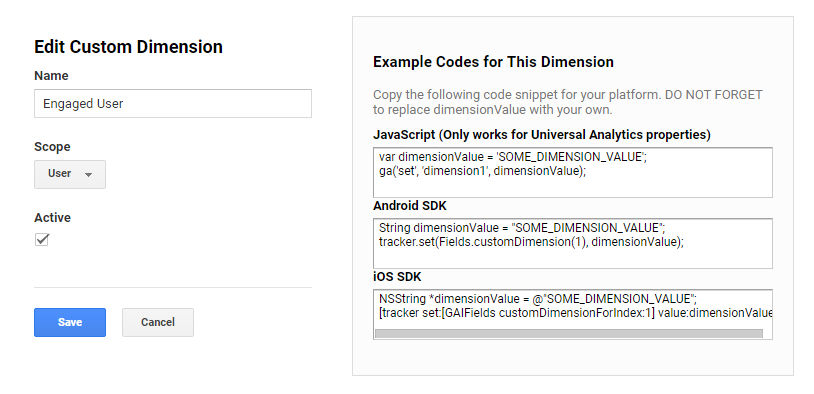
The code — which is documented fully on Google Developers and Google Support — is very simple:
var mozDimensionValue = 'Howdy Moz Fans';
ga('set', 'dimension1', mozDimensionValue);
As you can see, we’re defining the value of our dimension in a JavaScript variable, then using the set method with the ga() command queue to pass that variable to Analytics as a custom dimension. All subsequent hits on the page (pageviews, events, etc) would then include this custom dimension. Note that we refer to our dimension by its index number, which in this instance is 1; return to the main Custom Dimensions screen in the Admin area to see the index number which Analytics assigned to your new dimension.
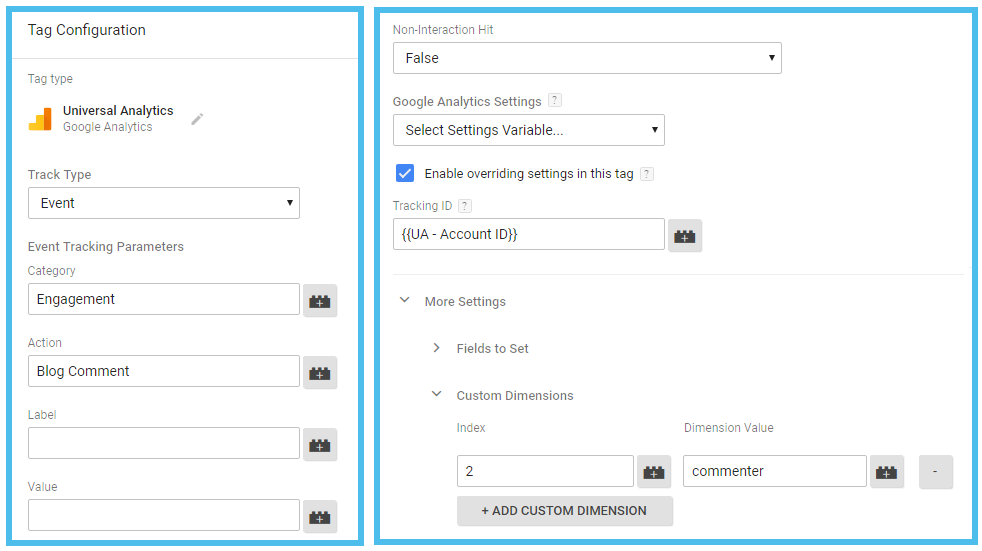
While your developer will typically handle the nuts and bolts of implementation — namely working out how best to pass your desired value into a JavaScript variable — the syntax is simple enough that it can be modified with ease. Using the first of our examples from earlier — tracking commenters — we want to send a value of ‘commenter’ to the Dimension 2 slot as part of an event hit which is configured to fire when somebody comments on the blog. With this slot pre-configured as a user-level dimension, we would use:
ga('send', 'event', 'Engagement', 'Blog Comment', {
  'dimension2':  'commenter'
});
This approach is all well and good, but it’s not without its drawbacks. It requires on-page tracking code changes, significant developer involvement, and doesn’t scale particularly well.
Thanks to Google Tag Manager, we can make things much easier.
Implementation with Google Tag Manager
If you use GTM to deploy your Analytics tracking — and for all but the simplest of implementations, I would recommend that you do — then deploying custom dimensions becomes far simpler. For those new to GTM, I gave an introductory talk on the platform at BrightonSEO (slides here), and I’d strongly suggest bookmarking both Google’s official documentation and Simo Ahava’s excellent blog.
For the sake of this tutorial, I’ll assume you’re familiar with the basics of GTM. To add a custom dimension to a particular tag — in this case, our blog comment event tag — simply expand "Custom Dimensions" under More Settings, and enter the index number and value of the dimension you’d like to set. Note that to see the More Settings configuration options, you’ll need to check the "Enable overriding settings in this tag" box if you’re not using a Google Analytics Settings Variable to configure your implementation.
What about our latter two examples, user demographics and out-of-stock products?
Our demographic scenario involved a user registration form which included an "Occupation" field. In contrast to our commenting example, the dimension value in this instance will need to be set programmatically depending on user input — it’s not a simple true/false variable that can be easily attached to a suitable event tag.
While we could use the "DOM Element" variable type to scrape the value of the "Occupation" drop-down field directly off the page, such an approach is not particularly scalable. A far better solution would be to fire the value of the field — along with the values of any other fields you feel may offer — to your website’s data layer.
Attention, people who don’t yet use a data layer:
While your development team will need to be involved in the implementation of a data layer, it’s well worth the effort. The advantages for your reporting can be huge, particularly for larger organizations. Defining the contents of your site’s data layer is a great opportunity for cross-team collaboration, and means that all potentially insightful data points are accessible in a machine-readable and platform-agnostic format, ready to be fired to GA. It’s also less subject to mistakes than ad-hoc tracking code. Much like how CSS separates out style from content, the data layer isolates your data.
Your developer will need to make the required information available in the data layer before you can define it as a Data Layer Variable in GTM and start using it in your tags. In the example below, imagine that the JavaScript variable 'myValue' has been configured to return the occupation entered by the user, as a string. We push it to the data layer, then define it as a Data Layer Variable in GTM:
var myValue = 'Professional Juggler';
dataLayer.push({'userOccupation': 'myValue'});

Attach a custom dimension to your User Registration event tag, as before, then simply reference this Data Layer Variable as the dimension value. Done!
Our third example follows the exact same principles: Having identified product-in-stock status as a hit-level datapoint with potential reporting insight, and with our data layer configured to return this as a variable on product pages, we simply configure our pageview tag to use this variable as the value for a new custom dimension.

Reporting & analysis
The simplest way to view custom dimension data in Analytics is to apply a secondary dimension to a standard report. In the example below, we’ve set our new "User Occupation" dimension as the secondary dimension in a New/Returning visitor report, allowing us to identify the professions of our newest users, and those of our frequent visitors.

By cross-referencing your new dimensions with behavioral data — think social share frequency by occupation — you can gain insight into the subsets of your audience who are most likely to engage or convert.
In truth, however, applying a secondary dimension in this manner is rarely conducive to effective analysis. In many instances, this approach will hugely increase the number of rows of data in your report without providing any immediately useful information. As such, it is often necessary to take things one step further: You can export the data into Excel for deeper analysis, or build a custom dashboard to pivot the data exactly the way you want it. In the example below, a chart and table have been configured to show our most viewed out-of-stock products over the course of the last week. Timely, actionable insight!

Sometimes, it’s necessary to completely isolate a subset of data in a dedicated view. This can be particularly powerful when used with a user-level custom dimension. Let’s say we wish to drill down to show only our most engaged users. We can do this by applying a Filter to a new view. In the following example, we have applied a custom ‘Include’ Filter which specifies a value of ‘commenter’ based on our "Blog Commenter" custom dimension.

The result? A dedicated view which reports on engaged users only.
For more information on the intricacies of filtering data based on session or user-level custom dimensions — and their implications for your Real Time reports — be sure to check out this great post from LunaMetrics.
Final thoughts
A deeper understanding of your target audience is never a bad thing. Custom dimensions are just one of the many ways in which Google Analytics can be extended beyond its default configuration to provide more granular, actionable insights tailored to the needs of your business.
As with many other advanced Analytics features, execution is everything. It’s better to have no custom dimensions at all than to waste your limited slots with dimensions which are poorly implemented or just plain unnecessary. Planning and implementation should be a collaborative process between your marketing, management, and development teams.
Hopefully this article has given you some ideas for how custom dimensions might offer you a new perspective on your audience.
Thanks for reading!
Sign up for The Moz Top 10, a semimonthly mailer updating you on the top ten hottest pieces of SEO news, tips, and rad links uncovered by the Moz team. Think of it as your exclusive digest of stuff you don't have time to hunt down but want to read!
No comments:
Post a Comment